

How to Run a Retail Audit Across 500 Districts Without Losing Data Quality
Running a retail audit in 20 outlets is a task. Running one in 20,000 across 500 districts is a different discipline entirely — and most of the things that go wrong are not the things people plan for.
Brands usually prepare for the obvious risks: cost, timeline, coverage. Then the data arrives and the problems turn out to be elsewhere. Two field executives interpreted “facing” differently. A third of the photographs are unusable. Nobody can explain why one state’s numbers look nothing like its neighbour’s.
Here’s what actually determines whether a large audit produces something you can use.
The core problem: consistency beats accuracy
This sounds wrong, so it’s worth being clear about.
If every enumerator in your audit measures shelf share slightly generously, your absolute numbers are inflated — but the comparison between Bihar and Karnataka still holds, and the trend from Q1 to Q2 still holds. You can work with that.
If half your enumerators measure generously and half measure strictly, and which half varies by state, then your absolute numbers are wrong and every comparison you’d want to make is contaminated. You can’t work with that at all.
Large audits are almost always used comparatively — region against region, period against period, our brand against the category. Consistency is what makes comparison valid. It’s the thing to optimise for, and it’s not the thing most audit designs prioritise.
Where consistency breaks
Ambiguous definitions
“Is the product available?” seems unambiguous until you’re standing in a shop.
Available means on the shelf. Does stock in the back room count? What about an empty display with stock arriving tomorrow? What about a different pack size than the one on your list? What about a competitor’s shelf strip with your product behind it?
Every one of these gets decided differently by different people unless you’ve decided in advance. Multiply by 40 questions and 800 enumerators.
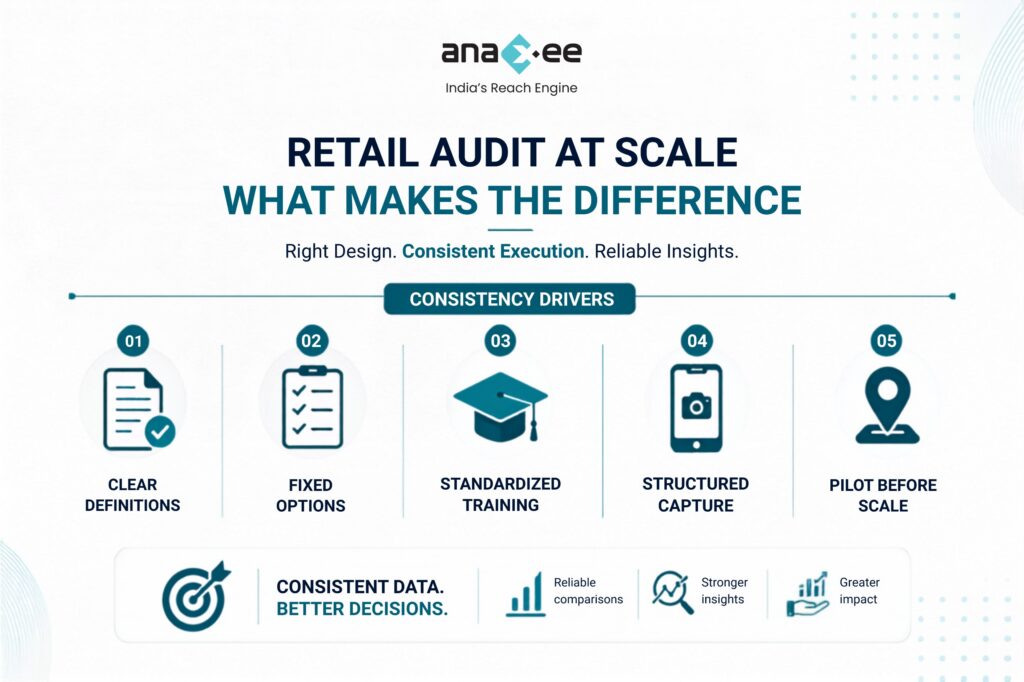
Write a definitions document. Make it specific enough to be boring. Every question needs an unambiguous rule and at least one edge case worked through. This is the highest-return document in the entire project and it’s the one that usually gets written after fieldwork starts.
Open text fields
Every open text field in a large audit is a data cleaning bill you haven’t received yet.
Ask enumerators to type a competitor brand name and you’ll get twelve spellings of the same brand. Ask for a “reason for non-stocking” and you’ll get 4,000 unique free-text answers that nobody will ever code.
Convert everything you can into a fixed option list, developed from a pilot. Keep one optional free-text box for genuine surprises, and accept that you’ll read a sample of it rather than analyse all of it.
Question order that invites shortcuts
If a long section can be skipped by answering “no” to the first question, some enumerators under time pressure will discover that route.
Design so that the fast path isn’t the one that skips work. Where a skip pattern is genuinely necessary, make the triggering question one that gets verified — through a photograph, or a back-check.
Training that happens once
An audit rolled out across 500 districts trains in waves. The first wave gets the trainer’s full attention and a fresh explanation. The eighth wave gets a tired version, delivered by someone who was themselves trained by wave three.
This is how state-level variation creeps into data that should be uniform. Standardise the training material rather than the trainer — recorded modules, the same worked examples, a short competency check before anyone goes to the field.
Building the quality system
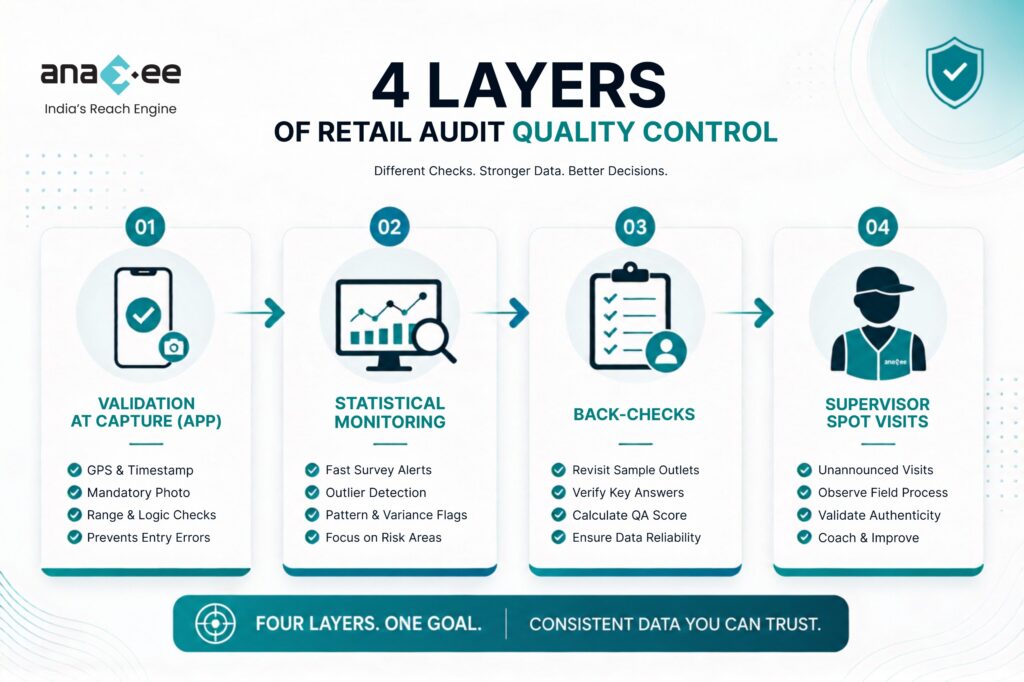
Four layers, all of them necessary.
Layer one: validation at capture. The app rejects impossible values, requires a photograph before proceeding, attaches GPS and timestamp at record level. This catches typos and structural gaps, nothing more.
Layer two: statistical monitoring. Watch the data as it arrives, by enumerator. Surveys completing far faster than average. Response distributions that differ from everyone else’s. Too little variance — an enumerator whose answers are suspiciously consistent. Records submitted in improbable geographic sequence.
These flags don’t prove anything individually. They tell you where to look.
Layer three: back-checks. A defined percentage of outlets re-visited by a different person, comparing answers on questions that shouldn’t change. Set the percentage in advance, define what counts as a failure, and write down what happens when one fails — because if that protocol doesn’t exist before fieldwork, it won’t be applied consistently during it.
Layer four: supervisor spot visits. Unannounced, in the field, alongside the enumerator. This catches things no system catches — an enumerator being turned away, a shop that closed months ago, an approach that irritates retailers.
The layers do different jobs. Brands that buy layer one and skip the rest end up with clean-looking data of unknown quality, which is arguably worse than obviously messy data.
Photographs: useful, but not automatically
Photographs are the most requested and least used artefact in retail audits.
They’re valuable for verification, for shelf share evidence, and for showing a sales meeting what a display actually looks like rather than describing it. But a folder of 40,000 unstructured photographs is not evidence — it’s an archive nobody opens.
Three things make them usable:
- Specify the shot. Whole shelf from a defined distance, not “a photo of the display.” Inconsistent framing makes comparison impossible.
- Structure the filing. Linked to outlet ID, date and question, retrievable in seconds. If retrieving a specific photograph takes an hour, nobody will do it when it matters.
- Decide what they’re for before collecting them. Verification, analysis, or communication. Each implies a different shot.
Sequencing a large rollout
Three phases, and skipping the first is the most expensive mistake available.
Pilot — 100 to 200 outlets across your hardest geographies. Not your easiest. The pilot exists to break your questionnaire, and your easy markets won’t break it. Expect to rewrite 20% of your questions afterwards. If you rewrite nothing, the pilot wasn’t testing hard enough.
Wave one — a few states, full protocol. Run every quality layer. Fix what surfaces. Confirm your cost-per-outlet assumptions against reality before committing to national scale.
National rollout — staggered, not simultaneous. Staggering lets you catch a systematic problem in state four instead of discovering it in all 26 at once. It costs a little time. It saves entire re-fielding exercises.
What to agree before anyone goes to a shop
Get these written down and signed off:
- Definitions document, with edge cases resolved
- Fixed option lists for every categorical question
- Back-check percentage and failure protocol
- Photograph specification and filing structure
- Replacement rule for outlets that are shut or gone
- Named owner for data queries, with a response time
- Raw data retention format and period
Any of these missing at kickoff will be improvised in the field, differently, by different people. That improvisation is exactly the inconsistency you’re trying to avoid.
The short version
A large retail audit fails quietly. You don’t get an error message — you get a dataset that looks complete, arrives on schedule, and quietly can’t support the comparison you commissioned it for.
The defence is unglamorous: precise definitions, fixed options, layered quality checks, a hard pilot, and a staggered rollout. None of it is clever. All of it is the difference between an audit that changes decisions and one that becomes a deck nobody references again.
Spend the money at the design stage. It’s the cheapest point in the project at which anything can still be fixed.
Anaxee runs large-scale retail audits for non-FMCG brands across 540+ districts and 11,000+ pincodes — shelf and visibility checks, stock counts, competitor presence and photographic evidence, with back-check protocols and supervisor verification built in. Delivered through 40,000+ Digital Runners, billed per outlet rather than per headcount. To discuss an audit design, book a conversation.