Frameworks often sound impressive — until you try implementing them.
So let’s decode how HEC actually works.
Step 1: Lifecycle Mapping
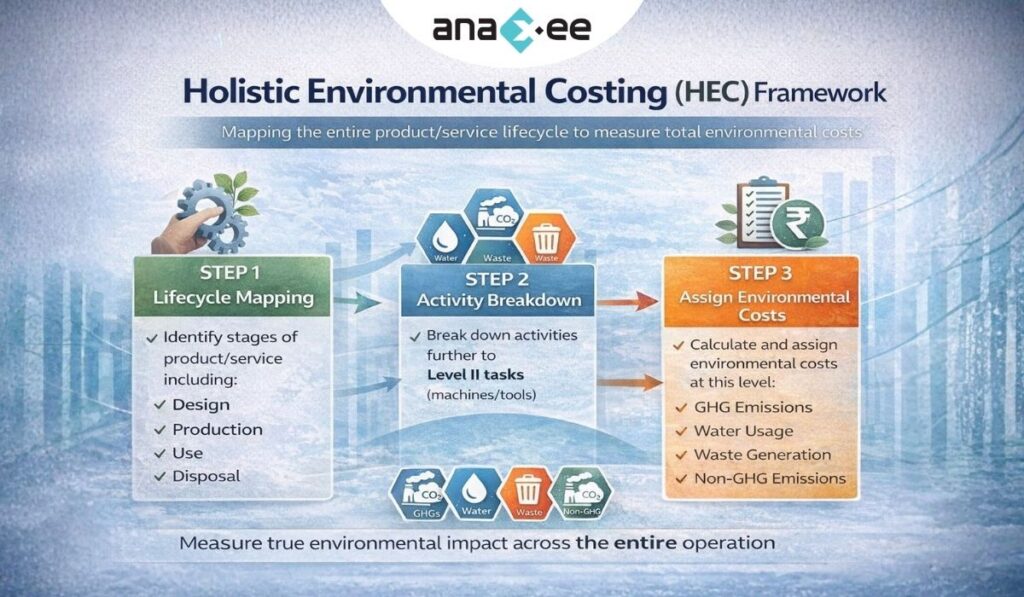
Instead of jumping to emissions calculators, HEC asks:
👉 What stages define your product or service?
Typically:
- Design
- Production
- Use
- Disposal R_GuidanceEnvironmentalCosting
Each stage hides environmental consequences.
Step 2: Activity-Based Breakdown
Now we zoom in.
Example: Biscuit manufacturing (as illustrated in the guidance note) R_GuidanceEnvironmentalCosting
Level I Activities:
- Dough mixing
- Moulding
- Baking
- Cooling
- Packaging
Then break further:
Level II → Machines / tools
Why?
Because impacts occur at the machine/resource level.
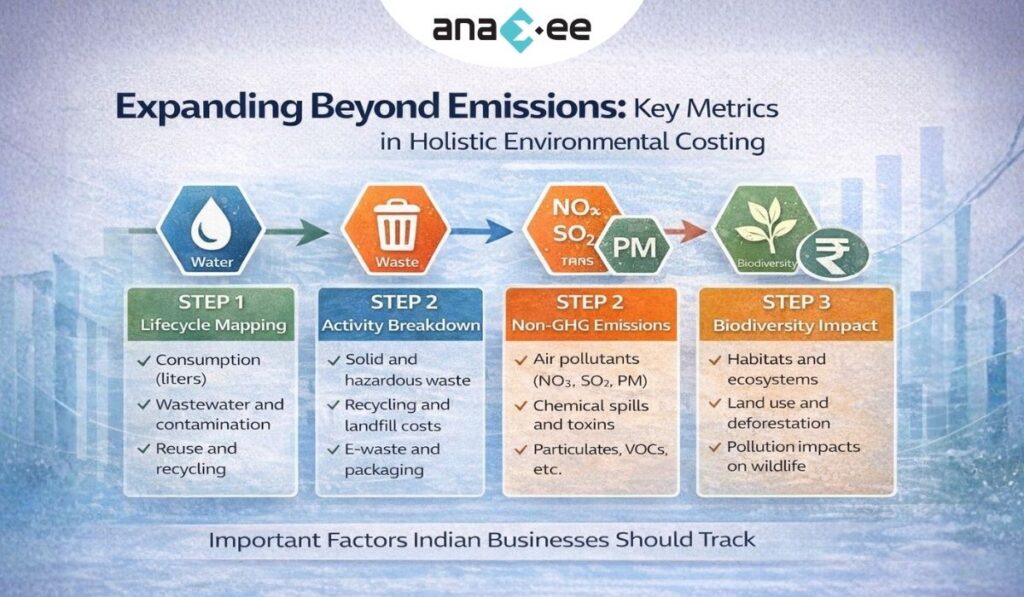
Step 3: Assign Environmental Costs
For each Level II activity:
✔ Electricity consumption
✔ Fuel use
✔ Water usage
✔ Waste generation
✔ Emissions
Captured in structured tables:
- GHG emissions
- Non-GHG emissions
- Waste R_GuidanceEnvironmentalCosting
Why This Granularity Matters
Without breakdown:
❌ Rough estimates
❌ Over/under reporting
❌ No mitigation clarity
With HEC:
✔ Precise hotspots
✔ Traceable data
✔ Audit-ready systems
Unexpected Bonus: Efficiency Insights
Environmental costing often reveals:
- Resource leakages
- Process inconsistencies
- Hidden waste streams
- Abnormal energy intensity
It becomes an operational excellence tool.
Reality Check
HEC is not plug-and-play software magic.
It requires:
✔ Process understanding
✔ Data discipline
✔ SOP-driven capture
✔ Cross-functional coordination
But once embedded → reporting, assurance, ESG analytics become dramatically easier.